Essay
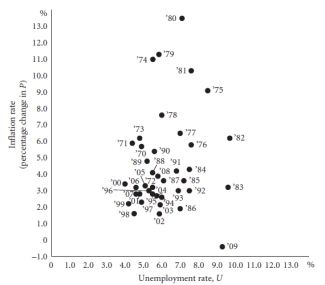
-The graph above plots unemployment rates and inflations rates from the time period between 1970 and 2009. What does this empirical evidence seem to suggest about the Phillips curve?
Correct Answer:

Verified
It appears to discredit the id...View Answer
Unlock this answer now
Get Access to more Verified Answers free of charge
Correct Answer:
Verified
View Answer
Unlock this answer now
Get Access to more Verified Answers free of charge
Q59: <img src="https://d2lvgg3v3hfg70.cloudfront.net/TB2925/.jpg" alt=" -Using the figure
Q60: During the 1960s, the Phillips curve relationship
Q61: It is well known that Henry Ford's
Q62: <img src="https://d2lvgg3v3hfg70.cloudfront.net/TB2925/.jpg" alt=" -Using the above
Q63: Differentiate between frictional unemployment, structural unemployment, and
Q65: Graphically illustrate and describe the principle of
Q66: Why do Classical economists believe that the
Q67: Explain what the Phillips curve represents.
Q68: What is potential GDP?
Q69: <img src="https://d2lvgg3v3hfg70.cloudfront.net/TB2925/.jpg" alt=" -Using the above