Essay
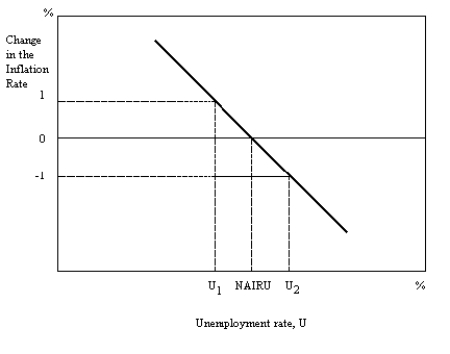
-Using the figure above, explain what would happen if the unemployment rate decreases from the NAIRU to U1 and stays at U1 for many periods. Assume that the inflation rate at the NAIRU was 4%.
Correct Answer:

Verified
In the first period the inflat...View Answer
Unlock this answer now
Get Access to more Verified Answers free of charge
Correct Answer:
Verified
View Answer
Unlock this answer now
Get Access to more Verified Answers free of charge
Q54: <img src="https://d2lvgg3v3hfg70.cloudfront.net/TB2925/.jpg" alt=" Figure 29.1 -Using
Q55: <img src="https://d2lvgg3v3hfg70.cloudfront.net/TB2925/.jpg" alt=" -Using the above
Q56: Show with the use of a graph
Q57: Draw a graph of a long-run Phillips
Q58: <img src="https://d2lvgg3v3hfg70.cloudfront.net/TB2925/.jpg" alt=" -Use the above
Q60: During the 1960s, the Phillips curve relationship
Q61: It is well known that Henry Ford's
Q62: <img src="https://d2lvgg3v3hfg70.cloudfront.net/TB2925/.jpg" alt=" -Using the above
Q63: Differentiate between frictional unemployment, structural unemployment, and
Q64: <img src="https://d2lvgg3v3hfg70.cloudfront.net/TB2925/.jpg" alt=" -The graph above