Essay
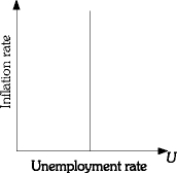
Draw a graph of a long-run Phillips curve. What does this graph imply about the long-run trade-off between inflation and unemployment? What does this graph imply about the effectiveness of monetary and fiscal policy in the long run?
Correct Answer:

Verified
There is no trade-off in the long run. I...View Answer
Unlock this answer now
Get Access to more Verified Answers free of charge
Correct Answer:
Verified
View Answer
Unlock this answer now
Get Access to more Verified Answers free of charge
Q52: Explain how the value that people place
Q53: Discuss the relative-wage explanation of unemployment.
Q54: <img src="https://d2lvgg3v3hfg70.cloudfront.net/TB2925/.jpg" alt=" Figure 29.1 -Using
Q55: <img src="https://d2lvgg3v3hfg70.cloudfront.net/TB2925/.jpg" alt=" -Using the above
Q56: Show with the use of a graph
Q58: <img src="https://d2lvgg3v3hfg70.cloudfront.net/TB2925/.jpg" alt=" -Use the above
Q59: <img src="https://d2lvgg3v3hfg70.cloudfront.net/TB2925/.jpg" alt=" -Using the figure
Q60: During the 1960s, the Phillips curve relationship
Q61: It is well known that Henry Ford's
Q62: <img src="https://d2lvgg3v3hfg70.cloudfront.net/TB2925/.jpg" alt=" -Using the above