Multiple Choice
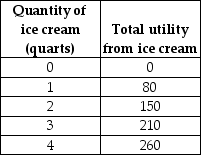
-Given the data in the above table,what is the marginal utility of the third quart of ice cream?
A) 80
B) 70
C) 60
D) 230
E) 210
Correct Answer:

Verified
Correct Answer:
Verified
Q284: <img src="https://d2lvgg3v3hfg70.cloudfront.net/TB1458/.jpg" alt=" -The figure above
Q285: Marginal utility is the change in total
Q286: The slope of the budget line can
Q288: <img src="https://d2lvgg3v3hfg70.cloudfront.net/TB1458/.jpg" alt=" -The above figure
Q290: <img src="https://d2lvgg3v3hfg70.cloudfront.net/TB1458/.jpg" alt=" -_ leads to
Q291: <img src="https://d2lvgg3v3hfg70.cloudfront.net/TB5274/.jpg" alt=" -Tom is stranded
Q291: Explain why total utility is maximized when
Q292: The benefit that John gets from eating
Q294: In the indifference curve/budget line diagram,consumers reach
Q362: "Every point on a demand curve represents