Multiple Choice
The following table shows the annual revenues (in millions of dollars) of a pharmaceutical company over the period 1990-2011. 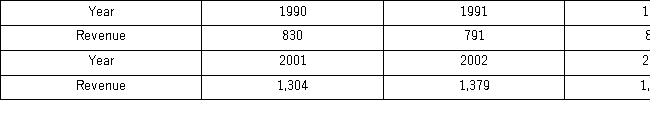
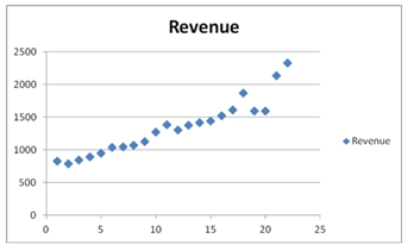 The Excel scatterplot shown indicates that the annual revenues have an increasing trend.Therefore,linear,exponential,quadratic,and cubic models were used to fit the trend,and the following relevant information became available after applying linear regression.
 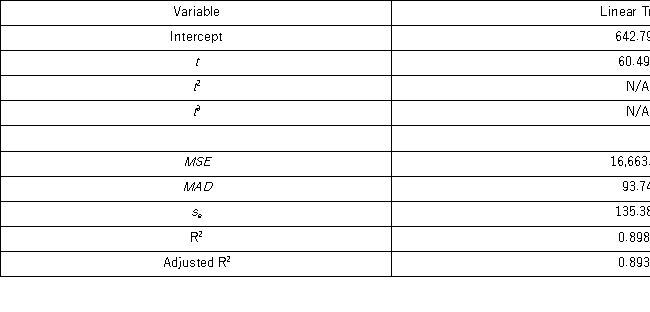 Using the linear trend equation,one can say that the predicted revenue increases by ____________.
A) $642,792,000 a year
B) $604,930,000 a year
C) $60,493,000 a year
D) $6,049,300 a year
Correct Answer:

Verified
Correct Answer:
Verified
Q15: The following table includes the information about
Q17: The following table shows the annual revenues
Q21: Prices of crude oil have been steadily
Q22: In the decomposition method,which of the following
Q23: Given the estimated model <img src="https://d2lvgg3v3hfg70.cloudfront.net/TB4266/.jpg" alt="Given
Q24: The following ratio-to-moving averages for the seasonally
Q27: The _ is a trend model that
Q36: In a moving average method, when a
Q70: The regression y<sub>t</sub> = β<sub>0</sub> + β<sub>1</sub>y<sub>t</sub><sub>-1</sub>
Q118: In the time series decomposition method, to