Multiple Choice
The following table shows the annual revenues (in millions of dollars) of a pharmaceutical company over the period 1990-2011. 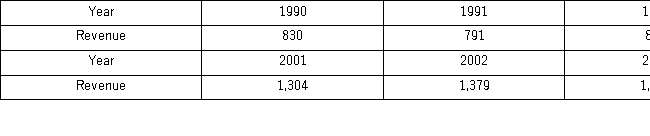
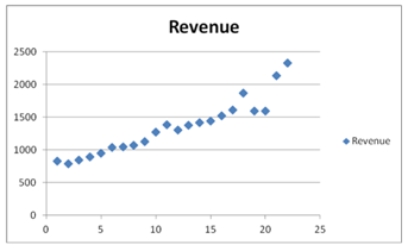 The Excel scatterplot shown indicates that the annual revenues have an increasing trend.Therefore,linear,exponential,quadratic,and cubic models were used to fit the trend,and the following relevant information became available after applying linear regression.
 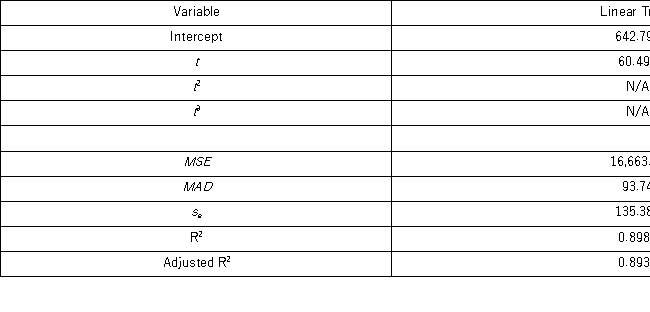 Which of the following is the revenue forecast for 2012 found by the linear trend equation?
A) About 2 billion 149 million dollars
B) About 2 billion and 189 million dollars
C) About 2 billion and 334 million dollars
D) About 2 billion and 34 million dollars
Correct Answer:

Verified
Correct Answer:
Verified
Q12: The following table includes the information about
Q13: The following table includes the information about
Q15: The following table includes the information about
Q20: The following table shows the annual revenues
Q21: Prices of crude oil have been steadily
Q22: In the decomposition method,which of the following
Q24: Which of the following types of trend
Q27: The _ is a trend model that
Q70: The regression y<sub>t</sub> = β<sub>0</sub> + β<sub>1</sub>y<sub>t</sub><sub>-1</sub>
Q118: In the time series decomposition method, to