Essay
The following table shows the annual revenues (in millions of dollars)of a pharmaceutical company over the period 1990-2011. 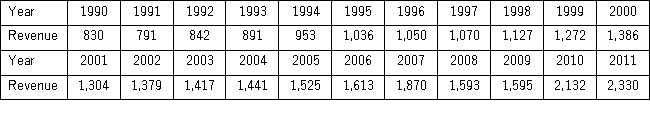 The autoregressive models of order 1 and 2,yt = β0 + β1yt - 1 + εt,and yt = β0 + β1yt - 1 + β2yt - 2 + εt,were applied on the time series to make revenue forecasts.The relevant parts of Excel regression outputs are given below.
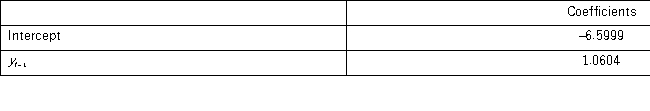
Model AR(1): 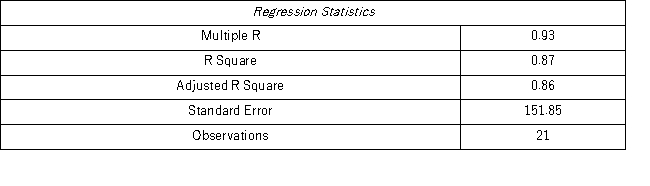
 Model AR(2):
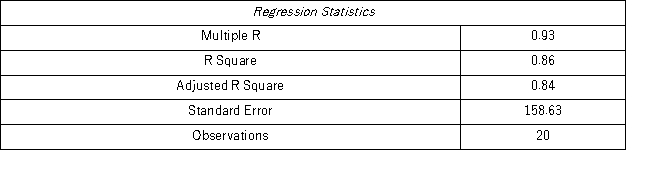
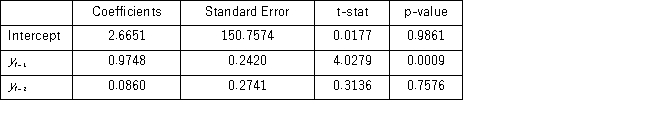 Compare Excel outputs for AR(1)and AR(2)and choose the forecasting model that seems to be better.
Correct Answer:

Verified
AR(1)has one explanatory variable less b...View Answer
Unlock this answer now
Get Access to more Verified Answers free of charge
Correct Answer:
Verified
View Answer
Unlock this answer now
Get Access to more Verified Answers free of charge
Q8: The following table shows the annual revenues
Q9: Which of the following formulas is used
Q12: The following table includes the information about
Q13: The following table includes the information about
Q15: The following table includes the information about
Q24: Which of the following types of trend
Q27: The _ is a trend model that
Q79: The exponential trend model is attractive when
Q83: The _ method is a smoothing technique
Q107: The centered moving average (CMA), applied in