Multiple Choice
The following table shows the annual revenues (in millions of dollars) of a pharmaceutical company over the period 1990-2011. 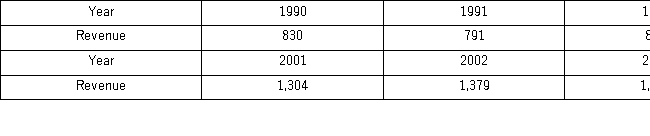
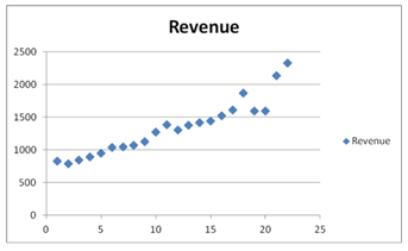 The Excel scatterplot shown indicates that the annual revenues have an increasing trend.Therefore,linear,exponential,quadratic,and cubic models were used to fit the trend,and the following relevant information became available after applying linear regression.
 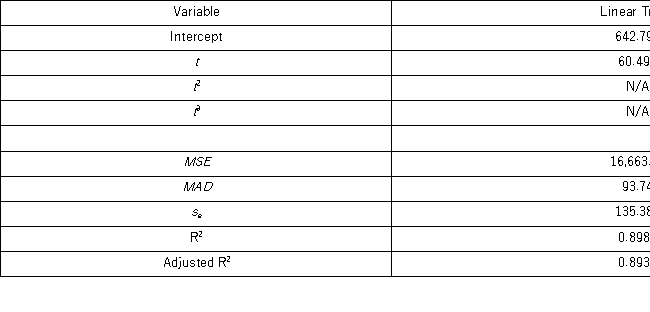 When three polynomial trend equations are compared,which of them provides the best fit?
A) Linear
B) Exponential
C) Quadratic
D) Cubic
Correct Answer:

Verified
Correct Answer:
Verified
Q3: Which of the following is not a
Q4: In the decomposition method,which of the following
Q5: The following table shows the annual revenues
Q9: Which of the following formulas is used
Q11: The following table shows the annual revenues
Q12: The following table includes the information about
Q13: The following table includes the information about
Q79: The exponential trend model is attractive when
Q83: The _ method is a smoothing technique
Q107: The centered moving average (CMA), applied in