Essay
The following table shows the annual revenues (in millions of dollars)of a pharmaceutical company over the period 1990-2011. 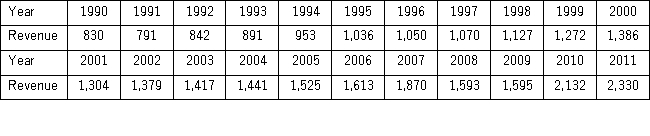 The autoregressive models of order 1 and 2,yt = β0 + β1yt - 1 + εt,and yt = β0 + β1yt - 1 + β2yt - 2 + εt,were applied on the time series to make revenue forecasts.The relevant parts of Excel regression outputs are given below.
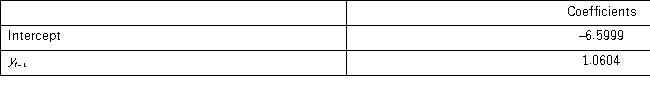
Model AR(1): 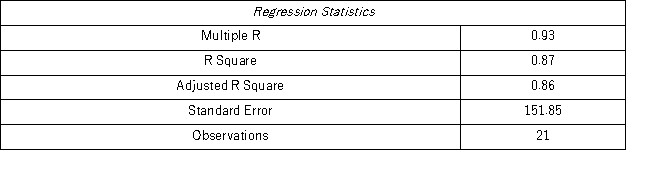
 Model AR(2):
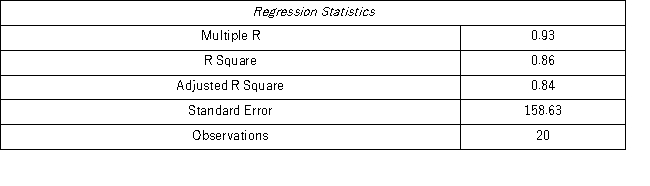
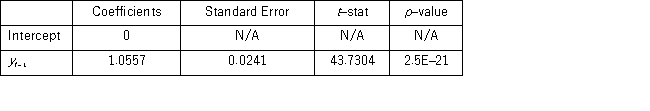
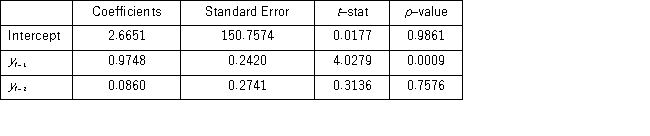 When for AR(1),H0: β0 = 0 is tested against HA: β0 ≠ 0,the p-value of this t test shown by Excel output is 0.9590.This could suggest that the model yt = β1yt-1 + εt might be an alternative to the AR(1)model yt = β0 + β1yt-1 + εt.Excel partial output for this simplified model is as follows:
 (Use Regression in Data Analysis of Excel. )
Compare the autoregressive models yt = β0 + β1yt-1 + εt;yt = β0 + β1yt-1 + β2yt-2 + εt,andyt = β1yt-1 + εt,through the use of MSE and MAD.
Correct Answer:

Verified
For each of regression equations:  = b0 + ...
View Answer
Unlock this answer now
Get Access to more Verified Answers free of charge
Correct Answer:
Verified
View Answer
Unlock this answer now
Get Access to more Verified Answers free of charge
Q12: When a time series is analyzed by
Q30: Which of the following types of trend
Q42: In the model y<sub>t</sub> = β<sub>0</sub> +
Q61: In which of the following situations is
Q98: When a time series has both trend
Q100: Prices of crude oil have been steadily
Q101: Based on quarterly data collected over the
Q102: The model <img src="https://d2lvgg3v3hfg70.cloudfront.net/TB4266/.jpg" alt="The model
Q104: The following ratio-to-moving averages for the seasonally
Q105: Prices of crude oil have been steadily