Multiple Choice
The following Excel scatterplot with the fitted quadratic regression equation illustrates the observed relationship between productivity and the number of hired workers. 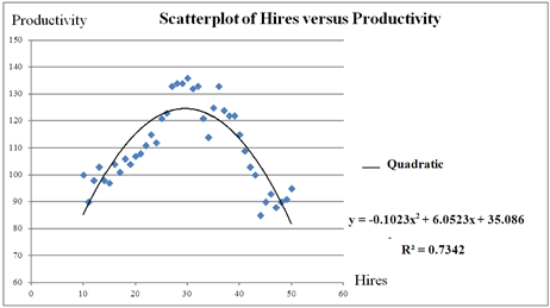 The quadratic regression equation found is _________.
A)  = 35.086 + 6.0523Hires - 0.1023Hires2
B)  = 6.0523 + 35.086Hires - 0.1023Hires2
C)  = 6.0523 − 35.086Hires + 0.1023Hires2
D) 
Correct Answer:

Verified
Correct Answer:
Verified
Q81: Typically,the sales volume declines with an increase
Q82: For the quadratic regression equation <img src="https://d2lvgg3v3hfg70.cloudfront.net/TB4266/.jpg"
Q83: The fit of the regression equations <img
Q84: It is believed that the sales volume
Q85: For the quadratic equation <img src="https://d2lvgg3v3hfg70.cloudfront.net/TB4266/.jpg" alt="For
Q85: The coefficient of determination R<sup>2</sup> cannot be
Q87: Thirty employed single individuals were randomly selected
Q88: A model in which both the response
Q89: Typically,the sales volume declines with an increase
Q90: To compute the coefficient of determination R<sup>2