Multiple Choice
Typically,the sales volume declines with an increase of a product price.It has been observed,however,that for some luxury goods the sales volume may increase when the price increases.The following Excel output illustrates this rather unusual relationship. 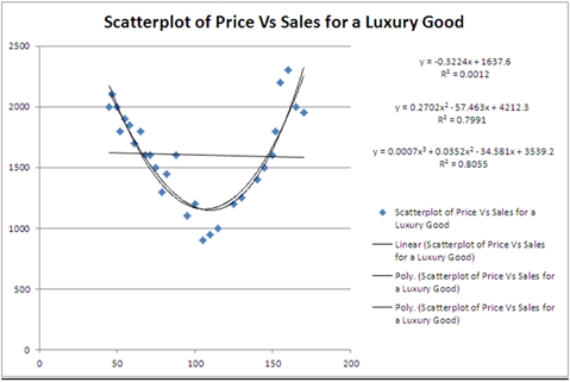 For the considered range of the price,the relationship between Price and Sales should be described by a _________.
A) concave function
B) hyperbola
C) convex function
D) linear function
Correct Answer:

Verified
Correct Answer:
Verified
Q84: It is believed that the sales volume
Q85: For the quadratic equation <img src="https://d2lvgg3v3hfg70.cloudfront.net/TB4266/.jpg" alt="For
Q85: The coefficient of determination R<sup>2</sup> cannot be
Q86: The following Excel scatterplot with the fitted
Q87: Thirty employed single individuals were randomly selected
Q88: A model in which both the response
Q90: To compute the coefficient of determination R<sup>2
Q92: Thirty employed single individuals were randomly selected
Q93: Which of the following regression models is
Q94: The following Excel scatterplot with the fitted