Multiple Choice
The following data show the demand for an airline ticket dependent on the price of this ticket. 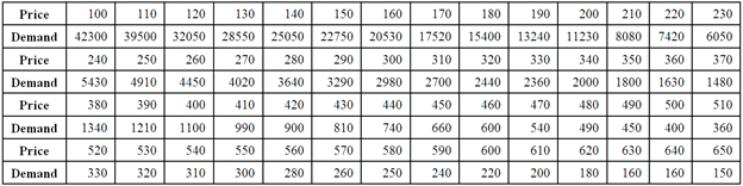 For the assumed cubic and log-log regression models,Demand = β0 + β1Price + β2Price2 + β3Price3 + ε and ln(Demand) = β0 + β1ln(Price) + ε,the following regression results are available.
 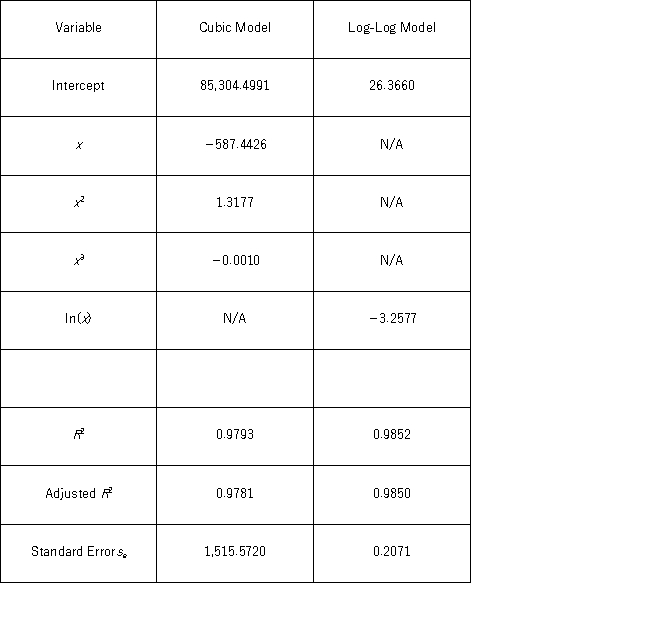 Which of the following is the percentage of variations in ln(Demand) explained by the log-log regression equation?
A) 98.52%
B) 98.50%
C) 91.39%
D) 97.93%
Correct Answer:

Verified
Correct Answer:
Verified
Q2: In which of the following models does
Q3: Thirty employed single individuals were randomly selected
Q4: When not all variables are transformed into
Q5: Which of the following regression models is
Q6: In which of the following models does
Q8: The following data,with the corresponding Excel scatterplot,show
Q9: If the data are available on the
Q11: The scatterplot shown below represents a typical
Q64: For the exponential model ln(y) = β<sub>0</sub>
Q76: The log-log regression model is _ in