Multiple Choice
The following data show the demand for an airline ticket dependent on the price of this ticket. 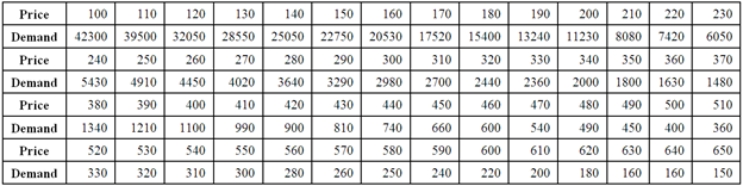 For the assumed cubic and log-log regression models,Demand = β0 + β1Price + β2Price2 + β3Price3 + ε and ln(Demand) = β0 + β1ln(Price) + ε,the following regression results are available.
 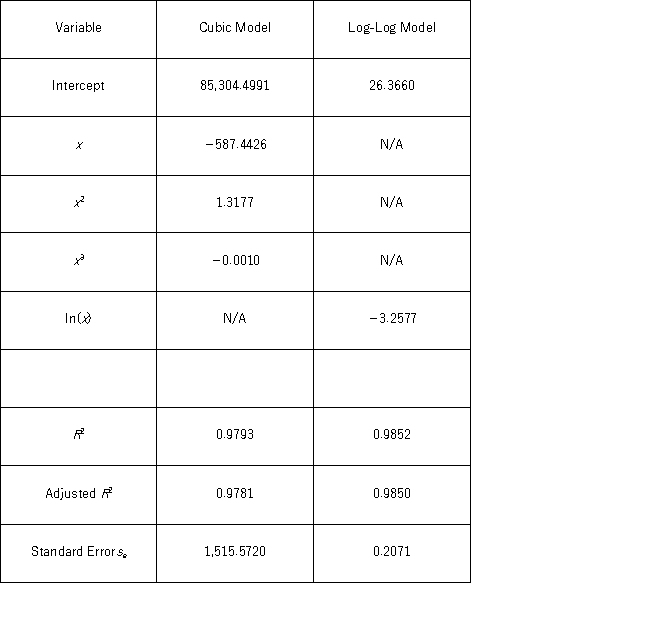 Assuming that the sample correlation coefficient between Demand and
  = exp(26.3660 - 3.2577 ln(Price) + (0.2071) 2/2) is 0.956,what is the percentage of variations in Demand explained by the log-log regression equation?
A) 98.52%
B) 98.50%
C) 91.39%
D) 97.93%
Correct Answer:

Verified
Correct Answer:
Verified
Q20: The equation y = β<sub>0</sub> + β<sub>1</sub>x
Q21: The following Excel scatterplot with the fitted
Q22: Which of the following regression models is
Q24: The log-log and the _ models can
Q27: The cubic regression model allows for two
Q28: A quadratic regression model is a special
Q29: The quadratic and logarithmic models,y = β<sub>0</sub>
Q30: For the log-log model ln(y)= β<sub>0</sub> +
Q56: An inverted U-shaped curve is also known
Q63: The logarithmic model is especially attractive when