Multiple Choice
The following Excel scatterplot with the fitted quadratic regression equation illustrates the observed relationship between productivity and the number of hired workers. 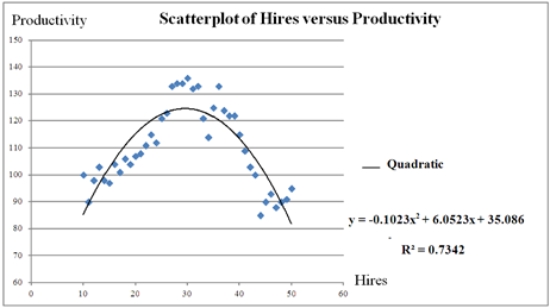 Assuming that the number of hired workers must be an integer,what is the maximum productivity to achieve?
A) 29.58
B) 30.00
C) 124.603
D) 124.585
Correct Answer:

Verified
Correct Answer:
Verified
Q16: In which of the following models does
Q17: Thirty employed single individuals were randomly selected
Q18: The following data show the demand for
Q19: Typically,the sales volume declines with an increase
Q20: The equation y = β<sub>0</sub> + β<sub>1</sub>x
Q22: Which of the following regression models is
Q24: The log-log and the _ models can
Q25: The following data show the demand for
Q56: An inverted U-shaped curve is also known
Q63: The logarithmic model is especially attractive when