menu-iconExamlexExamLexServices

Discover

Ask a Question
  1. All Topics
  2. Topic
    Statistics
  3. Study Set
    Business Statistics Communicating with Numbers Study Set 2
  4. Exam
    Exam 12: Chi-Square Tests
  5. Question
    In the Following Table,individuals Are Cross-Classified by Their Age Group
Solved

In the Following Table,individuals Are Cross-Classified by Their Age Group

Question 88

Question 88

Multiple Choice

In the following table,individuals are cross-classified by their age group and income level. In the following table,individuals are cross-classified by their age group and income level.   Which of the following is the estimated joint probability for the  low income and 21-35 age group  cell? A)  0.0830 B)  0.0874 C)  0.0996 D)  0.1328 
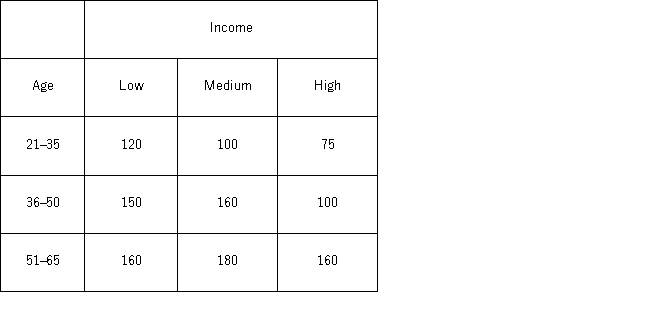
Which of the following is the estimated joint probability for the "low income and 21-35 age group" cell?


A) 0.0830
B) 0.0874
C) 0.0996
D) 0.1328

Correct Answer:

verifed

Verified

Unlock this answer now
Get Access to more Verified Answers free of charge

Related Questions

Q83: The following frequency distribution shows the monthly

Q84: In the following table,likely voters' preferences of

Q85: The following table shows the distribution of

Q86: A university has six colleges and takes

Q87: In the following table,individuals are cross-classified by

Q87: The calculation of the Jarque-Bera test statistic

Q90: The following frequency distribution shows the monthly

Q91: The following table shows the distribution of

Q92: The following table shows the cross-classification of

Q104: The chi-square test statistic measures the difference

Examlex

ExamLex

About UsContact UsPerks CenterHomeschoolingTest Prep

Work With Us

Campus RepresentativeInfluencers

Links

FaqPricingChrome Extension

Download The App

Get App StoreGet Google Play

Policies

Privacy PolicyTerms of ServiceHonor CodeCommunity Guidelines

Scan To Download

qr-code

Copyright © (2025) ExamLex LLC.

Privacy PolicyTerms Of ServiceHonor CodeCommunity Guidelines