Multiple Choice
The following frequency distribution shows the monthly stock returns for Home Depot for the years 2003 through 2007. 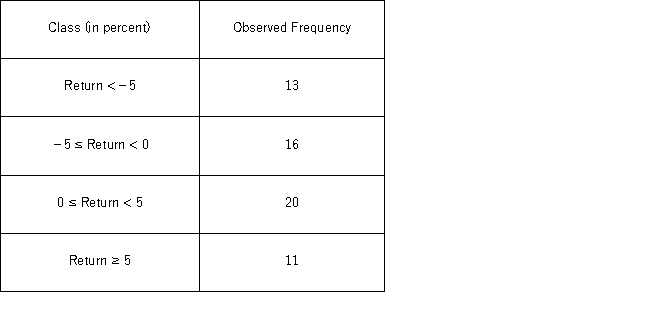 Over the time period,the following summary statistics are provided: Mean = 0.31%,Standard deviation = 6.49%,Skewness = 0.15,and Kurtosis = 0.38.Using the Jarque-Bera test for normality,the p-value is __________.
A) less than 0.01
B) between 0.01 and 0.05
C) between 0.05 and 0.10
D) greater than 0.10
Correct Answer:

Verified
Correct Answer:
Verified
Q28: The chi-square test of a contingency table
Q85: The following table shows the distribution of
Q86: A university has six colleges and takes
Q87: The calculation of the Jarque-Bera test statistic
Q87: In the following table,individuals are cross-classified by
Q88: In the following table,individuals are cross-classified by
Q91: The following table shows the distribution of
Q92: The following table shows the cross-classification of
Q94: A fund manager wants to know if
Q104: The chi-square test statistic measures the difference