Multiple Choice
The heights (in cm) for a random sample of 60 males were measured.The sample mean is 166.55,the standard deviation is 12.57,the sample kurtosis is 0.12,and the sample skewness is −0.23.The following table shows the heights subdivided into non-overlapping intervals. 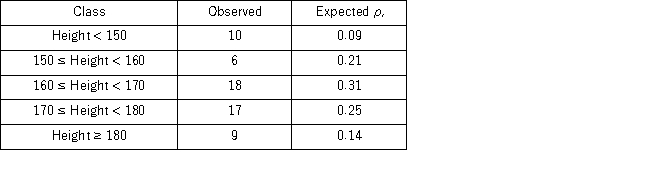 Using the p-value approach and α = 0.05,the decision and conclusion are ___________________________________________________________________.
A) reject the null hypothesis;conclude that heights are normally distributed
B) reject the null hypothesis;conclude that heights are not normally distributed
C) do not reject the null hypothesis;conclude that heights are normally distributed
D) do not reject the null hypothesis;conclude that heights are not normally distributed
Correct Answer:

Verified
Correct Answer:
Verified
Q73: The following table shows numerical summaries of
Q74: In the following table,individuals are cross-classified by
Q75: Suppose Bank of America would like to
Q77: The following frequency distribution shows the monthly
Q79: For a multinomial experiment, which of the
Q80: Suppose you want to determine if the
Q81: A fund manager wants to know if
Q82: A fund manager wants to know if
Q83: The following frequency distribution shows the monthly
Q84: If the null hypothesis is rejected by