Essay
The following table shows numerical summaries of the worst quarter returns (in percentages)for a sample of 121 hedge funds. 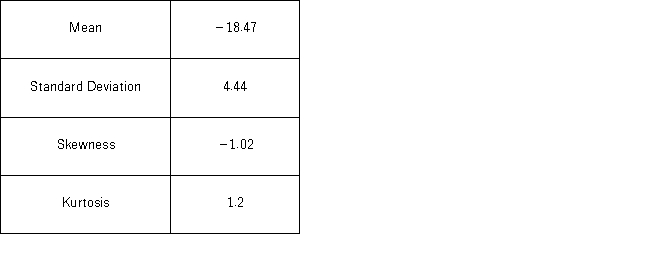 a.Set up the competing hypotheses for the Jarque-Bera test for normality for the worst quarter returns.
b.Calculate the value of the test statistic and find thep-value.
c.Does the evidence suggest the worst quarter returns do not have a normal distribution at the 5% significance level?
Correct Answer:

Verified
When testing whether sample data are der...View Answer
Unlock this answer now
Get Access to more Verified Answers free of charge
Correct Answer:
Verified
View Answer
Unlock this answer now
Get Access to more Verified Answers free of charge
Q68: The following frequency distribution shows the monthly
Q69: Suppose Bank of America would like to
Q70: The heights (in cm)for a random sample
Q71: The following table shows the distribution of
Q72: The heights (in cm)for a random sample
Q74: In the following table,individuals are cross-classified by
Q75: Suppose Bank of America would like to
Q77: The following frequency distribution shows the monthly
Q78: The heights (in cm)for a random sample
Q84: If the null hypothesis is rejected by