Multiple Choice
The following frequency distribution shows the monthly stock returns for Home Depot for the years 2003 through 2007. 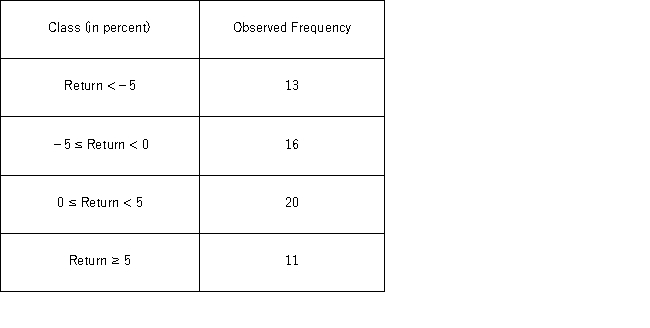 Over the time period,the following summary statistics are provided: Mean = 0.31%,Standard deviation = 6.49%,Skewness = 0.15,and Kurtosis = 0.38.The expected frequency for the class 0 ≤ Return < 5 if the return is normally distributed is _______.
A) 12.37
B) 16.44
C) 17.05
D) 14.15
Correct Answer:

Verified
Correct Answer:
Verified
Q62: For the goodness-of-fit test for normality to
Q64: The following table shows the distribution of
Q65: The following table shows the distribution of
Q66: A card-dealing machine deals spades (1),hearts (2),clubs
Q67: In the following table,individuals are cross-classified by
Q69: Suppose Bank of America would like to
Q70: The heights (in cm)for a random sample
Q71: The following table shows the distribution of
Q72: The heights (in cm)for a random sample
Q73: The following table shows numerical summaries of