Multiple Choice
The following frequency distribution represents the number of hours studied per week by a sample of 50 students. 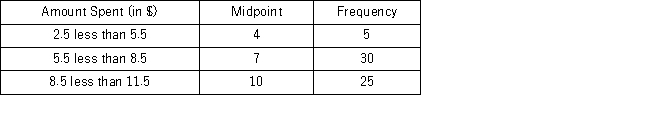 The standard deviation of the number of hours studied is ____.
A) 1.89
B) 2.79
C) 3.50
D) 3.56
Correct Answer:

Verified
Correct Answer:
Verified
Related Questions
Q52: The Boom company has recently decided to
Q82: The empirical rule can be used to
Q130: The following table shows the annual returns
Q131: A portfolio's annual total returns (in percent)for
Q132: A bowler's scores for a sample of
Q133: There are five rows of students seated
Q135: A portfolio manager generates a 5% return
Q136: The annual returns (in percent)for a sample
Q137: Yearly returns (rounded to the nearest percent)for
Q138: Which five values are graphed on a