True/False
To approximate the width of a class in the creation of a bar chart,we may use this formula: 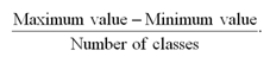
Correct Answer:

Verified
Correct Answer:
Verified
Related Questions
Q75: The following data represent scores on a
Q76: In the accompanying stem-and-leaf diagram,the values in
Q77: The accompanying relative frequency distribution represents the
Q78: In the accompanying stem-and-leaf diagram,the values in
Q80: Consider the following frequency distribution. <img src="https://d2lvgg3v3hfg70.cloudfront.net/TB4266/.jpg"
Q81: An auto parts chain asked customers to
Q82: The dividend yields of the stocks in
Q83: Students in Professor Smith's business statistics course
Q84: A survey of 400 unemployed people was
Q90: For quantitative data, a cumulative relative frequency