Multiple Choice
The following data represent scores on a pop quiz in a statistics section. 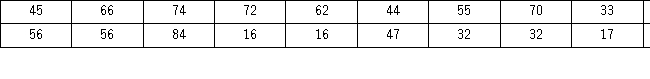 Suppose the data on quiz scores will be grouped into five classes.The width of the classes for a frequency distribution or histogram is the closestto ______.
A) 10
B) 12
C) 14
D) 16
Correct Answer:

Verified
Correct Answer:
Verified
Q70: Students in Professor Smith's business statistics course
Q71: The following table shows average wind speeds
Q72: Consider the following stem-and-leaf diagram. <img src="https://d2lvgg3v3hfg70.cloudfront.net/TB4266/.jpg"
Q73: Consider the following frequency distribution. <img src="https://d2lvgg3v3hfg70.cloudfront.net/TB4266/.jpg"
Q76: In the accompanying stem-and-leaf diagram,the values in
Q77: The accompanying relative frequency distribution represents the
Q78: In the accompanying stem-and-leaf diagram,the values in
Q79: To approximate the width of a class
Q80: Consider the following frequency distribution. <img src="https://d2lvgg3v3hfg70.cloudfront.net/TB4266/.jpg"
Q90: For quantitative data, a cumulative relative frequency