Multiple Choice
The accompanying chart shows the numbers of books written by each author in a collection of cookbooks.What type of chart is this? 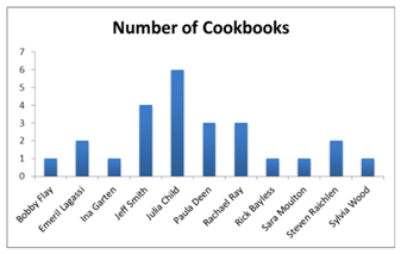
A) Bar chart for qualitative data
B) Bar chart for quantitative data
C) Frequency histogram for qualitative data
D) Frequency histogram for quantitative data
Correct Answer:

Verified
Correct Answer:
Verified
Q13: When constructing a scatterplot for two quantitative
Q54: The manager at a water park constructed
Q57: Consider the following frequency distribution. <img src="https://d2lvgg3v3hfg70.cloudfront.net/TB4266/.jpg"
Q58: The following is a list of five
Q60: Thirty students at Eastside High School took
Q61: An analyst constructed the following frequency distribution
Q62: An analyst constructed the following frequency distribution
Q64: The following data represent the recent sales
Q100: A scatterplot depicts a positive _ relationship,
Q107: The relative frequency of a category is