Multiple Choice
The manager at a water park constructed the following frequency distribution to summarize attendance in July and August. 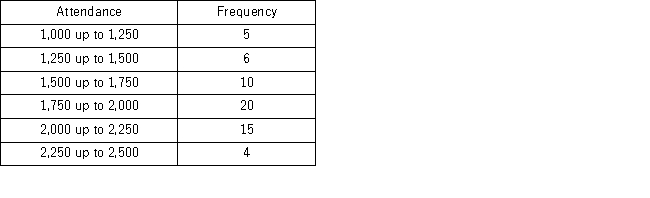 What of the following is the most likely attendance range?
A) 2,000 up to 2,500
B) 1,750 up to 2,000
C) 1,000 up to 1,750
D) 1,250 up to 1,750
Correct Answer:

Verified
Correct Answer:
Verified
Q50: An auto parts chain asked customers to
Q51: A stem-and-leaf diagram is constructed by separating
Q52: Consider the following frequency distribution. <img src="https://d2lvgg3v3hfg70.cloudfront.net/TB4266/.jpg"
Q53: A hair stylist records the hair color
Q57: Consider the following frequency distribution. <img src="https://d2lvgg3v3hfg70.cloudfront.net/TB4266/.jpg"
Q58: The following is a list of five
Q59: The accompanying chart shows the numbers of
Q84: How does an ogive differ from a
Q100: A scatterplot depicts a positive _ relationship,
Q107: The relative frequency of a category is