Multiple Choice
The accompanying table shows students' scores from the final exam in a history course. 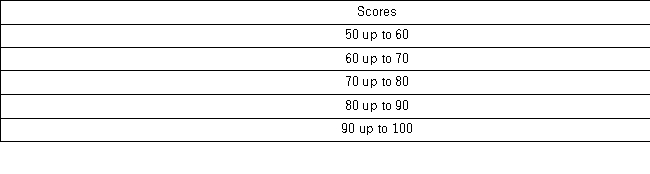 How many of the students scored at least 70 but less than 90?
A) 24
B) 31
C) 55
D) 88
Correct Answer:

Verified
Correct Answer:
Verified
Related Questions
Q33: The following table displays the top 40
Q34: What type of relationship is indicated in
Q36: The following histogram represents the number of
Q37: Thirty students at Eastside High School took
Q39: The accompanying chart shows the number of
Q41: The _ is a graphical technique that
Q42: Construct a stem-and-leaf diagram for the following
Q43: What type of relationship is indicated in
Q69: A bar chart depicts the frequency or
Q91: When displaying quantitative data, what is an