Essay
The following table displays the top 40 American League batting averages of the 2011 season. 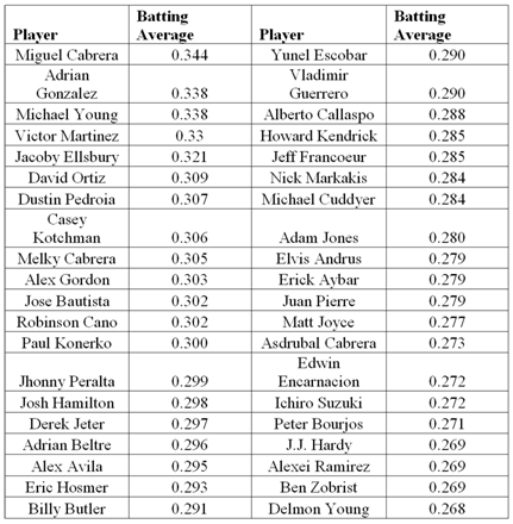 a.Construct frequency,relative frequency,and cumulative relative frequency distributions that group the data in classes of 0.265 up to 0.280,0.280 up to 0.295,0.295 up to 0.310,and so on.
b.How many of these players have a batting average above 0.340? What proportion of these players has a batting average of at least 0.280 but below 0.295? What percentage of these players has a batting average below 0.325?
c.Construct a relative frequency histogram.Is the distribution symmetric? If not,is it positively or negatively skewed?
d.Construct an ogive.
e.Using the ogive,approximately what proportion of the players in this group has a batting average above 0.290?
Correct Answer:

Verified
a.To construct the frequency distributio...View Answer
Unlock this answer now
Get Access to more Verified Answers free of charge
Correct Answer:
Verified
View Answer
Unlock this answer now
Get Access to more Verified Answers free of charge
Q12: When summarizing quantitative data it is always
Q28: For which of the following data sets
Q29: The following frequency distribution displays the weekly
Q32: The following stem-and-leaf diagram shows the speeds
Q34: What type of relationship is indicated in
Q36: The following histogram represents the number of
Q37: Thirty students at Eastside High School took
Q38: The accompanying table shows students' scores from
Q69: A bar chart depicts the frequency or
Q73: Horizontal bar charts are constructed by placing