Multiple Choice
The following stem-and-leaf diagram shows the speeds in miles per hour (mph) of 14 cars approaching a toll booth on a bridge in Oakland,California. 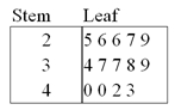 How many of the cars were traveling faster than 25 mph but slower than 40 mph?
A) 8
B) 9
C) 10
D) 12
Correct Answer:

Verified
Correct Answer:
Verified
Q12: When summarizing quantitative data it is always
Q27: A histogram is a series of rectangles
Q28: For which of the following data sets
Q29: The following frequency distribution displays the weekly
Q33: The following table displays the top 40
Q34: What type of relationship is indicated in
Q36: The following histogram represents the number of
Q37: Thirty students at Eastside High School took
Q69: A bar chart depicts the frequency or
Q73: Horizontal bar charts are constructed by placing