Essay
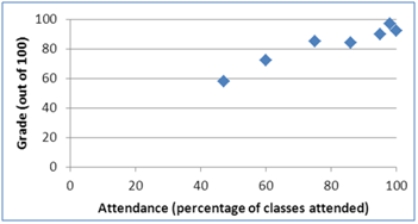
A statistics instructor computes the grade and percentage of classes that each of his students attends.Construct a scatterplot from the data displayed next.Does a relationship exist between attendance and grade? 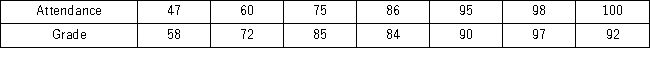
Correct Answer:

Verified
To construct the scatterplot,plot each a...View Answer
Unlock this answer now
Get Access to more Verified Answers free of charge
Correct Answer:
Verified
View Answer
Unlock this answer now
Get Access to more Verified Answers free of charge
Q64: A frequency distribution for qualitative data groups
Q64: The following data represent the recent sales
Q65: The organization of the Girl Sprouts has
Q66: The following data represent the recent sales
Q70: Students in Professor Smith's business statistics course
Q71: The following table shows average wind speeds
Q72: Consider the following stem-and-leaf diagram. <img src="https://d2lvgg3v3hfg70.cloudfront.net/TB4266/.jpg"
Q73: Consider the following frequency distribution. <img src="https://d2lvgg3v3hfg70.cloudfront.net/TB4266/.jpg"
Q90: For quantitative data, a cumulative relative frequency
Q123: Which of the following best describes a