Multiple Choice
Consider the following stem-and-leaf diagram. 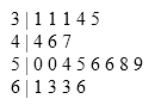 Which of the following statements is correct?
A) There are a total of 10 data values in this data set.
B) The data value that occurs most often is 50.
C) This largest data value is 59.
D) The range 50-59 contains the most values.
Correct Answer:

Verified
Correct Answer:
Verified
Q64: A frequency distribution for qualitative data groups
Q69: A statistics instructor computes the grade and
Q70: Students in Professor Smith's business statistics course
Q71: The following table shows average wind speeds
Q73: Consider the following frequency distribution. <img src="https://d2lvgg3v3hfg70.cloudfront.net/TB4266/.jpg"
Q75: The following data represent scores on a
Q76: In the accompanying stem-and-leaf diagram,the values in
Q77: The accompanying relative frequency distribution represents the
Q90: For quantitative data, a cumulative relative frequency
Q123: Which of the following best describes a