Multiple Choice
A researcher measured the height (in feet) and volume of usable lumber (in cubic feet) of 32 cherry trees.The goal is to determine if the volume of usable lumber can be estimated from the height of a tree.The results are plotted below: 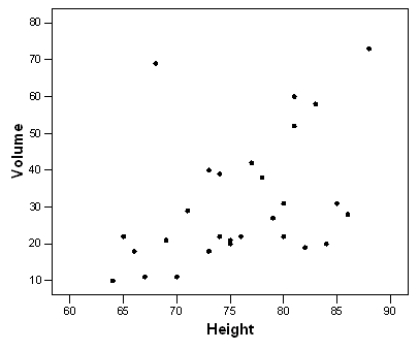 Select all descriptions that apply to the scatterplot.
A) There is a positive association between height and volume.
B) There is a negative association between height and volume.
C) There is an outlier in the plot.
D) The plot is skewed to the left.
E) Both A and C
Correct Answer:

Verified
Correct Answer:
Verified
Q18: Malaria is a leading cause of infectious
Q19: A researcher measured the height (in feet)and
Q20: Scatterplots can be used to explain the
Q21: The "direction" in scatterplots refers to the
Q22: When looking for relationships between two quantitative
Q24: When examining a scatterplot for strength,you are
Q25: Malaria is a leading cause of infectious
Q26: Explanatory variables are also called _ variables.
Q27: Time plots are special scatterplots where the
Q28: The graph below is a plot of