True/False
The scatterplot below displays data collected from 20 adults on their age and overall GPA at graduation. 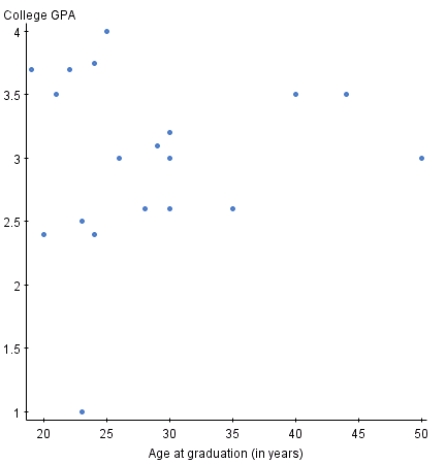
There appear to be outliers in the data set.
Correct Answer:

Verified
Correct Answer:
Verified
Related Questions
Q27: Time plots are special scatterplots where the
Q28: The graph below is a plot of
Q29: When examining a scatterplot for form,you are
Q30: You can describe the overall pattern of
Q31: Fill in the blank.The owner of a
Q33: Which of the following statements about a
Q34: Malaria is a leading cause of infectious
Q35: Fill in the blank.The Environmental Protection Agency
Q36: A variable that explains or causes change
Q37: Which type of transformation may help change