Multiple Choice
The data below represent the means from 15 sample control charts for the amount of time in minutes it takes students to complete a quiz in a basic statistics course.The same quiz was given to 15 different sections of a basic statistics course.Five students were sampled from each class and each mean is shown below. 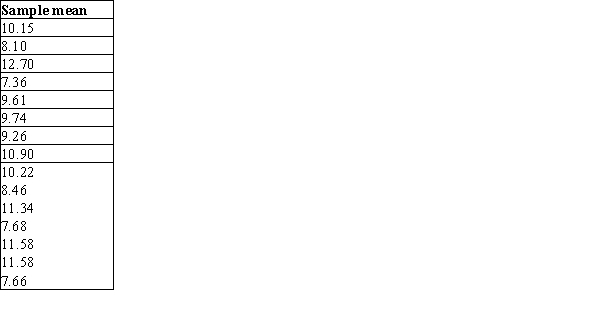 Which graph is the control chart for
  ?
?
A) 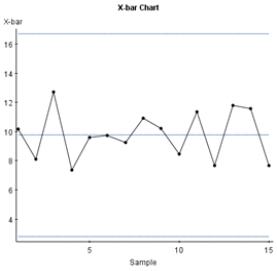
B) 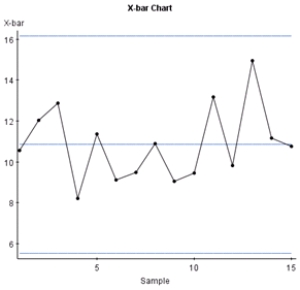
C) 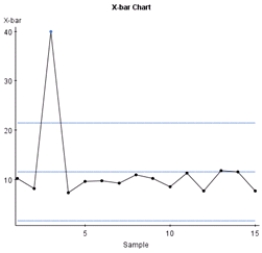
D) None of the above
Correct Answer:

Verified
Correct Answer:
Verified
Q63: Piston rings for an automotive engine are
Q64: C<sub>p</sub> and C<sub>pk</sub> are very useful whether
Q65: Parts manufactured by an injection molding process
Q66: Parts manufactured by an injection molding process
Q67: What is the main function of a
Q69: The sampling distribution of <img src="https://d2lvgg3v3hfg70.cloudfront.net/TB5065/.jpg" alt="The
Q70: At the start of the semester,a professor
Q71: Parts manufactured by an injection molding process
Q72: An automobile dealer checks on the quality
Q73: Out of control signals are produced from