Short Answer
Independent random samples of households in the four U.S.regions (Northeast,Midwest,South,and West)yielded data on last year's energy consumption.We are interested in assessing,at the 1% significance level,if the data provide sufficient evidence to conclude that last year's average energy consumption was different among the four U.S.regions.Assume that energy consumption in the four regions is Normally distributed.
SPSS was used to create the side-by-side boxplots shown below. 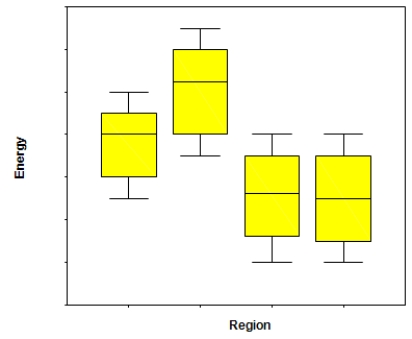 What assumption needed for an ANOVA F test can be checked with this graph?
Correct Answer:

Verified
The assumption that ...View Answer
Unlock this answer now
Get Access to more Verified Answers free of charge
Correct Answer:
Verified
View Answer
Unlock this answer now
Get Access to more Verified Answers free of charge
Q38: In a study on scholastic test scores
Q39: A study compares six groups with five
Q40: At a large automobile factory,four different machines
Q41: Wild horse populations on federal lands have
Q42: Battery life of tablet computers is of
Q44: It is widely believed that a person's
Q45: A storeowner wishes to compare the average
Q46: Independent random samples of households in the
Q47: At a large automobile factory,four different machines
Q48: In a study on scholastic test scores