Short Answer
Independent random samples of households in the four U.S.regions (Northeast,Midwest,South,and West)yielded data on last year's energy consumption.We are interested in assessing,at the 1% significance level,if the data provide sufficient evidence to conclude that last year's average energy consumption was different among the four U.S.regions.Assume that energy consumption in the four regions is Normally distributed.
SPSS was used to create the side-by-side boxplots shown below. 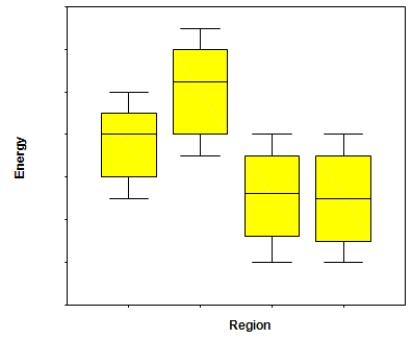 Based on the boxplots,does it seem like the assumption is satisfied? Explain briefly.
Correct Answer:

Verified
Yes,it does because ...View Answer
Unlock this answer now
Get Access to more Verified Answers free of charge
Correct Answer:
Verified
View Answer
Unlock this answer now
Get Access to more Verified Answers free of charge
Q41: Wild horse populations on federal lands have
Q42: Battery life of tablet computers is of
Q43: Independent random samples of households in the
Q44: It is widely believed that a person's
Q45: A storeowner wishes to compare the average
Q47: At a large automobile factory,four different machines
Q48: In a study on scholastic test scores
Q49: Bleaching chemicals are used in the pulp
Q50: A study compares three population means.Three independent
Q51: Which of the following statements about the