Multiple Choice
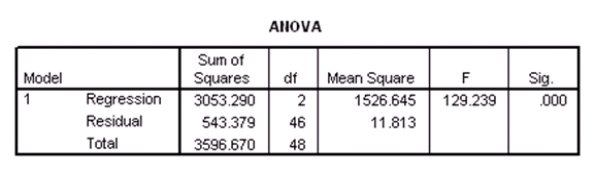
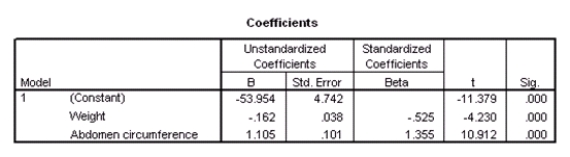
Researchers at a large nutrition and weight management company are trying to build a model to predict a person's body fat percentage from an array of variables such as body weight,height,and body measurements around the neck,chest,abdomen,hips,biceps,etc.A variable selection method is used to build a simple model.SPSS output for the final model is given below. 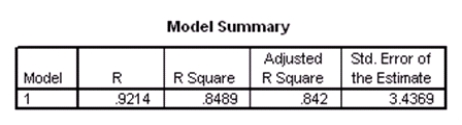
 A graph of the residuals versus the predicted values is given below.
 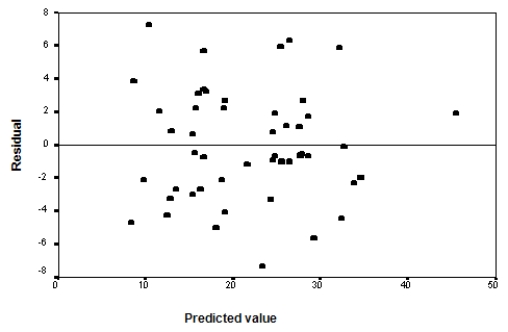 What assumption do we check with this graph?
A) The Normality of the error terms
B) The independence of the residuals
C) The constant variance assumption of the predicted values
D) None of the above
Correct Answer:

Verified
Correct Answer:
Verified
Q1: Campus crime rates are generally lower than
Q2: Campus crime rates are generally lower than
Q3: In multiple regression,what does the parameter <font
Q5: The NFL keeps track of a large
Q6: The variable mood takes on the values
Q7: The data referred to in this question
Q8: A researcher is investigating possible explanations for
Q9: The NFL keeps track of a large
Q10: Campus crime rates are generally lower than
Q11: In multiple regression,a small P-value from the