Multiple Choice
Thirty students were asked,"How much time did you spend studying for the last quiz?" The histograms below were all used on the same data;however,the class size was changed for each one.Which histogram below best displays the data?
A) 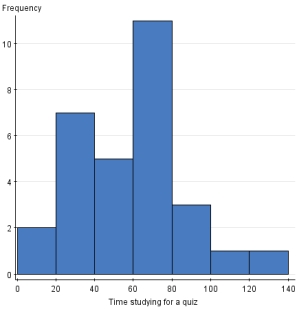
B) 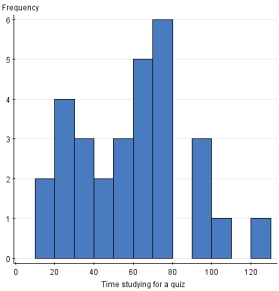
C) 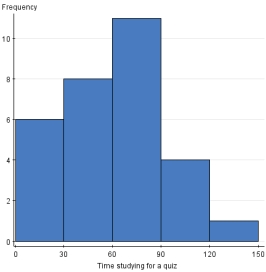
D) 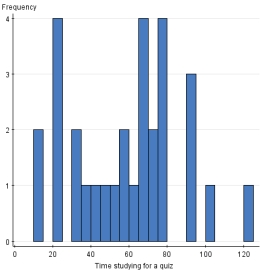
Correct Answer:

Verified
Correct Answer:
Verified
Related Questions
Q45: The World Malaria Report (2008)has information on
Q46: During the early part of the 1994
Q47: The pie chart provides information on all
Q48: A study is being conducted on air
Q49: The asking prices (in thousands of dollars)for
Q51: Malaria is a leading cause of infectious
Q52: We have a data set where the
Q53: A sample of employees of a large
Q54: A consumer agency is testing appliances for
Q55: The stemplot below displays data from 30