Multiple Choice
Malaria is a leading cause of infectious disease and death worldwide.The table below represents the mean number of reported malaria cases (between 1996 and 2006) for each of 10 West African countries,as published in the journal Statistica Neerlandica in 2010. 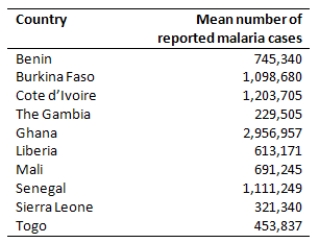 What is the best method to display these data?
A) Histogram
B) Pie chart
C) Bar graph
D) Stem-and-leaf plot
Correct Answer:

Verified
Correct Answer:
Verified
Q46: During the early part of the 1994
Q47: The pie chart provides information on all
Q48: A study is being conducted on air
Q49: The asking prices (in thousands of dollars)for
Q50: Thirty students were asked,"How much time did
Q52: We have a data set where the
Q53: A sample of employees of a large
Q54: A consumer agency is testing appliances for
Q55: The stemplot below displays data from 30
Q56: In the fuel efficiency study of 2007