Multiple Choice
A consumer agency is testing appliances for a series of articles in their magazine.Currently they are working with cooktops and ranges.They have selected 16 of the most commonly used models.Using a series of tests,the agency will estimate the lifetime of these models.A histogram of these (estimated) lifetimes is shown below. 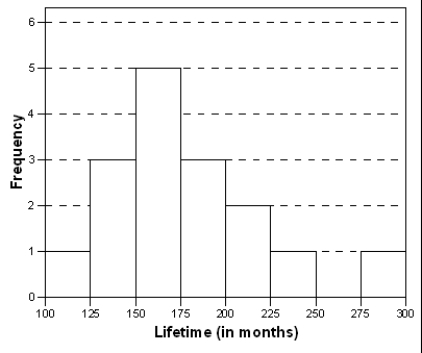 What is the proportion of these appliances that is estimated to last longer than 15 years?
A) More than half
B) Less than half
C) Equal to 4/16 = 0.25
D) It cannot be determined from this graph.
Correct Answer:

Verified
Correct Answer:
Verified
Q2: Suppose you are interested in comparing the
Q3: The Insurance Institute for Highway Safety publishes
Q4: The Insurance Institute for Highway Safety publishes
Q5: This is a standard deviation contest.Which of
Q6: The World Malaria Report (2008)has information on
Q8: The World Malaria Report (2008)has information on
Q9: The Environmental Protection Agency records data on
Q10: The timeplot below gives the number of
Q11: When drawing a histogram,it is important to<br>A)have
Q12: Which of the following statements are FALSE?<br>A)The