Multiple Choice
The timeplot below gives the number of burglaries committed each month for a city in Ohio.The plot is for the three-year period of January 1987 to December 1989. 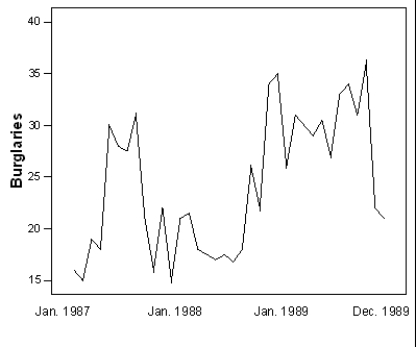 What is approximately the maximum number of burglaries for a month in 1988?
A) 20
B) 25
C) 30
D) 35
Correct Answer:

Verified
Correct Answer:
Verified
Q5: This is a standard deviation contest.Which of
Q6: The World Malaria Report (2008)has information on
Q7: A consumer agency is testing appliances for
Q8: The World Malaria Report (2008)has information on
Q9: The Environmental Protection Agency records data on
Q11: When drawing a histogram,it is important to<br>A)have
Q12: Which of the following statements are FALSE?<br>A)The
Q13: The first day of class,the Professor collects
Q14: The following boxplot is of the birth
Q15: When displaying the distribution of quantitative data,it