Multiple Choice
The Consumers Union measured the gas mileage in miles per gallon of 38 automobiles from the 1978-1979 model-year on a special test track.The pie chart below provides information about the country of manufacture of the automobiles used in this study by the Consumers Union. 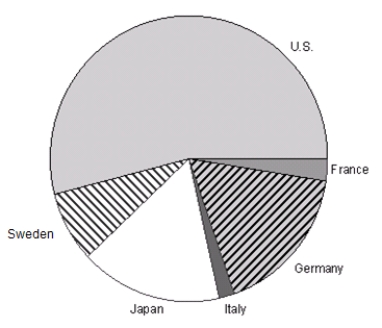 Which of the following bar graphs represents the same data as in the pie chart?
A) 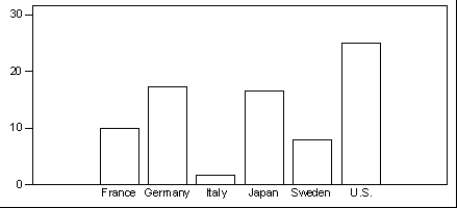
B) 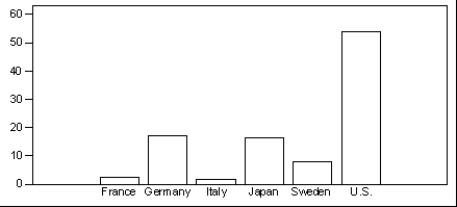
C) 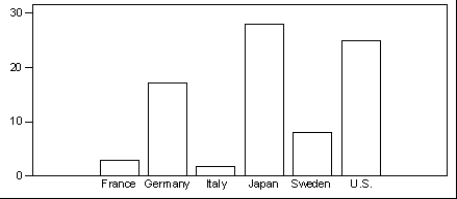
D) 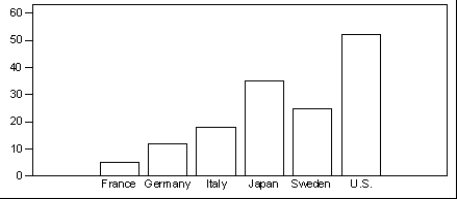
Correct Answer:

Verified
Correct Answer:
Verified
Q25: A consumer group surveyed the prices for
Q26: Variables that take numeric values for which
Q27: Malaria is a leading cause of infectious
Q28: The World Malaria Report (2008)has information on
Q29: The Environmental Protection Agency records data on
Q31: When using a pie chart,the sum of
Q32: The World Malaria Report (2008)has information on
Q33: The histogram below shows data from 30
Q34: The following data are the magnitudes of
Q35: The first day of class the professor