Multiple Choice
The histogram below shows data from 30 students who were asked,"How much time do you spend on the Internet in minutes?" How could you improve the histogram to better display the distribution? 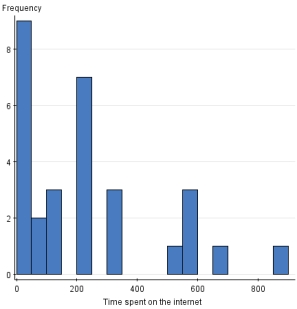
A) Increase the class size.
B) Decrease the class size.
C) Do nothing-the histogram is appropriate.
D) Add two more data points.
Correct Answer:

Verified
Correct Answer:
Verified
Q28: The World Malaria Report (2008)has information on
Q29: The Environmental Protection Agency records data on
Q30: The Consumers Union measured the gas mileage
Q31: When using a pie chart,the sum of
Q32: The World Malaria Report (2008)has information on
Q34: The following data are the magnitudes of
Q35: The first day of class the professor
Q36: When using a histogram to display categorical
Q37: A set of midterm exam scores has
Q38: A nationwide study was done to assess