Multiple Choice
During the early part of the 1994 baseball season,many sports fans and baseball players noticed that the number of home runs being hit seemed to be unusually large.The numbers of home runs by American League and National League teams based on the team-by-team statistics on home runs hit through Friday,June 3,1994,are given below (from the Columbus Dispatch,Sunday,June 5,1994) . 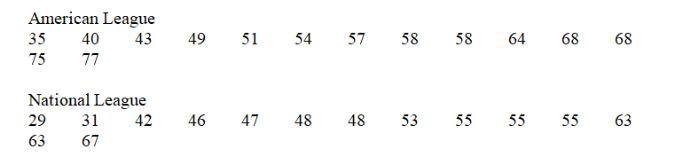
The mean and standard deviation of the number of home runs hit by National League teams are 50 and 11,respectively.Suppose we wish to measure how many more home runs than last year's average of 40 these teams have had this year by subtracting 40 from each number (a team with 55 home runs has 55 - 40 = 15 more home runs than last year's average) .What are the mean and standard deviation of these new numbers?
A) 50 and 11
B) 10 and 11
C) 50 and -29
D) 10 and -29
Correct Answer:

Verified
Correct Answer:
Verified
Q37: A set of midterm exam scores has
Q38: A nationwide study was done to assess
Q39: We have a data set where the
Q40: The Insurance Institute for Highway Safety publishes
Q41: The salaries of Major League Baseball players
Q43: Consider the following data which describe the
Q44: A reporter wishes to portray baseball players
Q45: The World Malaria Report (2008)has information on
Q46: During the early part of the 1994
Q47: The pie chart provides information on all