True/False
A nationwide study was done to assess the programming proficiency of students taking a statistical programming class.The students were asked their proficiency in the statistical software SAS.The survey was sent to students at over 100 universities and 112 responses were received from 21 different universities.The results were published in the journal International Mathematical Forum in 2011.The results in the form of a pie chart are shown below. 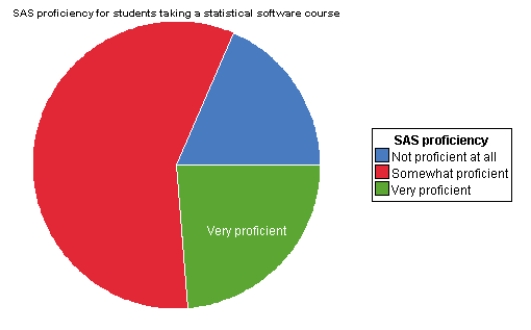 True or False.A bar graph would give the same information?
Correct Answer:

Verified
Correct Answer:
Verified
Q33: The histogram below shows data from 30
Q34: The following data are the magnitudes of
Q35: The first day of class the professor
Q36: When using a histogram to display categorical
Q37: A set of midterm exam scores has
Q39: We have a data set where the
Q40: The Insurance Institute for Highway Safety publishes
Q41: The salaries of Major League Baseball players
Q42: During the early part of the 1994
Q43: Consider the following data which describe the