Multiple Choice
The following boxplot is of the birth weights (in ounces) of 160 infants born in a local hospital. 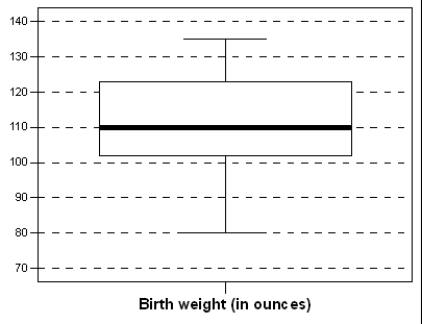 About 40 of the birth weights were below _______________.
A) 92 ounces
B) 102 ounces
C) 112 ounces
D) 122 ounces
Correct Answer:

Verified
Correct Answer:
Verified
Q9: The Environmental Protection Agency records data on
Q10: The timeplot below gives the number of
Q11: When drawing a histogram,it is important to<br>A)have
Q12: Which of the following statements are FALSE?<br>A)The
Q13: The first day of class,the Professor collects
Q15: When displaying the distribution of quantitative data,it
Q16: The distribution of a categorical variable is
Q17: Which of the following variables is categorical?<br>A)The
Q18: In a statistics class with 136 students,the
Q19: The following boxplot is of the birth