Multiple Choice
Consider the following graph of sales.
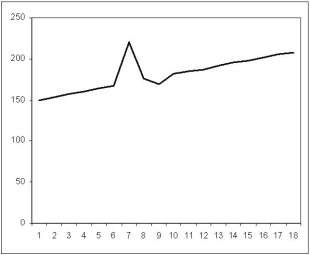 Which of the following characteristics is exhibited by the data?
A) trend only
B) trend plus seasonal
C) trend plus irregular
D) seasonal
Correct Answer:

Verified
Correct Answer:
Verified
Related Questions
Q123: If average forecast error is positive, it
Q124: Given the following data on the
Q125: Given the following data on the
Q126: Correlation measures the strength of relationship between
Q127: The manager of "Skis 4 U" is
Q128: A(n) _ forecast typically encompass a period
Q129: A trend is a gradual, long-term, up-or-down
Q130: Time series methods assume that what has
Q131: Coefficient of determination is the percentage of
Q132: If the absolute errors were calculated for