Short Answer
The diagram below shows the activities on the nodes, and the table shows the normal time and crash time (in days) and cost for each activity.
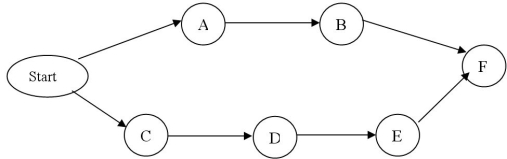
-Determine which activities should be crashed to shorten the project by 1 day.
Correct Answer:

Verified
Correct Answer:
Verified
Related Questions
Q96: If the earliest finish for activity C
Q97: The expected project completion time is assumed
Q98: A GANTT chart represents mainly<br>A) an immediate
Q99: Project teams are made up of individuals
Q100: The early finish for an activity on
Q102: The critical path is the longest path
Q103: A work breakdown structure breaks down a
Q104: Consider the following project.<br> <span
Q105: The critical path activities have no _.
Q106: Slack is the amount of time an