Multiple Choice
The diagram below shows the activities on the nodes, and the table shows the normal time and crash time (in days) and cost for each activity.
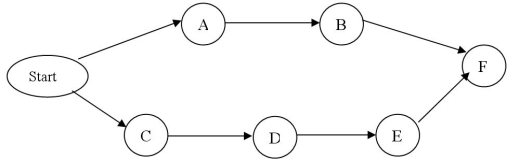
-Which activity should be crashed to reduce the project completion by 2 days?
A) Crash activity B by 1 day and Activity C by 1 day.
B) Crash activity E by 2 days.
C) Crash activity C by 1 day and activity E by 1 day.
D) Crash activity B by 2 days.
Correct Answer:

Verified
Correct Answer:
Verified
Q18: Consider the following project.<br> <span
Q19: If t is the expected completion time
Q21: Given the following information for a
Q22: A work breakdown structure breaks down a
Q24: A list of the tasks, broken down
Q25: Establishing precedence relationships is an element of
Q26: A dummy activity is used to show
Q27: The advantage of a Gantt chart over
Q28: If an activity cannot be delayed without
Q98: In PERT, the path with the fewest