Essay
Life Expectancy Narrative
An actuary wanted to develop a model to predict how long individuals will live. After consulting a number of physicians, she collected the age at death (y), the average number of hours of exercise per week (  ), the cholesterol level (
  ), and the number of points that the individual's blood pressure exceeded the recommended value (
  ). A random sample of 40 individuals was selected. The computer output of the multiple regression model is shown below.
The regression equation is 
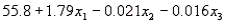
 S = 9.47 R-Sq = 22.5%
Analysis of Variance 
-Refer to Life Expectancy Narrative. Is there enough evidence at the 5% significance level to infer that the cholesterol level and the age at death are negatively linearly related? Justify your conclusion.
Correct Answer:

Verified
 vs. 0
vs. 0
Rejection region: t < - -1.69,...View Answer
Unlock this answer now
Get Access to more Verified Answers free of charge
Correct Answer:
Verified
Rejection region: t < -
View Answer
Unlock this answer now
Get Access to more Verified Answers free of charge
Q25: In multiple regression analysis, when the response
Q26: Personal Spending and Personal Income<br>Is personal spending
Q27: Life Expectancy Narrative<br>An actuary wanted to develop
Q28: In multiple regression analysis, the coefficient of
Q31: If we want to relate a random
Q32: Demographic Variables and TV Narrative<br>A statistician wanted
Q33: Chemical Comparisons Narrative<br>A chemist was interested in
Q34: For which of the following quantities is
Q35: College Textbook Sales Narrative<br>A publisher of college
Q176: The coefficient of multiple determination is calculated