Multiple Choice
Refer to the following figure when answering the following questions.
Figure 16.5: U.S. Household Net Worth 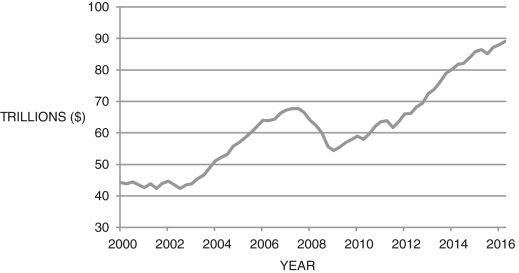
-Based on Figure 16.5, personal savings generally ________ over the period. However, personal savings ________ between roughly 2007 and 2009, which was likely due to ________.
A) fell; rose; precautionary savings
B) fell; fell; negative interest rates
C) rose; rose; an increase in interest rates
D) rose; rose; the wealth effect
E) fell; rose; higher gas prices
Correct Answer:

Verified
Correct Answer:
Verified
Q48: Figure 16.6: Personal Savings Rate <img src="https://d2lvgg3v3hfg70.cloudfront.net/TB6622/.jpg"
Q49: In the intertemporal budget constraint, <img src="https://d2lvgg3v3hfg70.cloudfront.net/TB6622/.jpg"
Q50: Which of the following is NOT household
Q51: Using the neoclassical model of consumption, an
Q52: With logarithmic utility, the Euler equation is
Q54: When applied to the first President Bush's
Q55: If moving an extra unit of today's
Q56: The parameter <img src="https://d2lvgg3v3hfg70.cloudfront.net/TB6622/.jpg" alt="The parameter
Q57: A higher interest rate _ and _.<br>A)
Q58: Consider Figure 16.11 below, which shows household