Essay
Consider Figure 16.11 below, which shows household savings, the unemployment rate, and official NBER recession dates (the gray, vertical bars). Explain the relationship between these three data. What economic concept does this corroborate?Figure 16.11: Savings, Unemployment, and Recessions 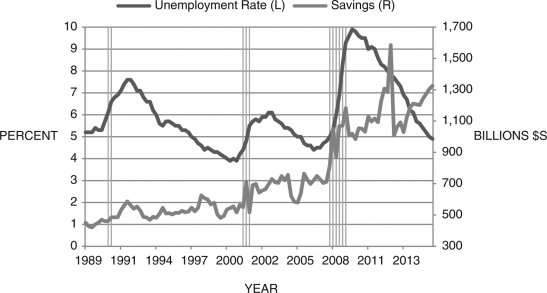
Correct Answer:

Verified
First, we observe that in times of reces...View Answer
Unlock this answer now
Get Access to more Verified Answers free of charge
Correct Answer:
Verified
View Answer
Unlock this answer now
Get Access to more Verified Answers free of charge
Q53: Refer to the following figure when answering
Q54: When applied to the first President Bush's
Q55: If moving an extra unit of today's
Q56: The parameter <img src="https://d2lvgg3v3hfg70.cloudfront.net/TB6622/.jpg" alt="The parameter
Q57: A higher interest rate _ and _.<br>A)
Q59: Suppose <img src="https://d2lvgg3v3hfg70.cloudfront.net/TB6622/.jpg" alt="Suppose ,
Q60: Household consumption accounts for about _ of
Q61: Refer to the following figure when answering
Q62: In the special case where <img src="https://d2lvgg3v3hfg70.cloudfront.net/TB6622/.jpg"
Q63: The intertemporal budget constraint is written as